

Fall 2024
While the United States Environmental Protection Agency has made significant changes to the National Ambient Air Quality Standards for particulate matter (PM) since their promulgation in 1997, it has yet to establish source- or chemical component-specific standards for PM2.5, despite a growing body of research suggesting differential human health risks.
Particulate matter (PM) is a class of chemically and physically diverse pollutants that exist in the air as liquid droplets or solid particles and are small enough to be inhaled. The United States Environmental Protection Agency (US EPA) evaluates exposures and potential health outcomes for three main size fractions of PM: “coarse” PM, with a median aerodynamic diameter less than 10 µm (PM10); “fine” PM, with a median aerodynamic diameter less than 2.5 µm (PM2.5); and ultrafine particles (UFPs), with a median aerodynamic diameter < 0.1 µm. Of the three size fractions, US EPA has determined that PM2.5 poses the greatest risk to human health (US EPA, 2021).
Over the past two decades, there has been a significant change in nationwide PM2.5 composition.”
The composition of PM2.5 is highly variable depending on the geographical location, emission sources, and the season. In general, PM2.5 contains primary particles emitted directly into the atmosphere and secondary particles that form via processes, such as photochemical oxidation mechanisms. Local and regional PM2.5 concentrations can vary due to different emission sources, atmospheric conditions, and dispersion patterns. Depending on geographical location, different sources may contribute to PM2.5 levels, including vehicle traffic; biomass burning; power plants; and industrial, ship, and aircraft emissions (Thangavel et al., 2022; US EPA, 2021). Ground level PM2.5 concentrations and compositions are sensitive to meteorological variables, including air temperature and relative humidity, contributing to day-of-week and seasonal variations. For example, air quality measurements may show a relatively higher concentration of PM2.5 in the winter due to stable meteorological conditions and increased biomass burning. Further, sulfate (SO42-) and organic carbon (OC) together account for the majority of PM2.5 mass in metropolitan areas during the summer months, while higher nitrate (NO3–) concentrations occur in the winter (US EPA, 2021).
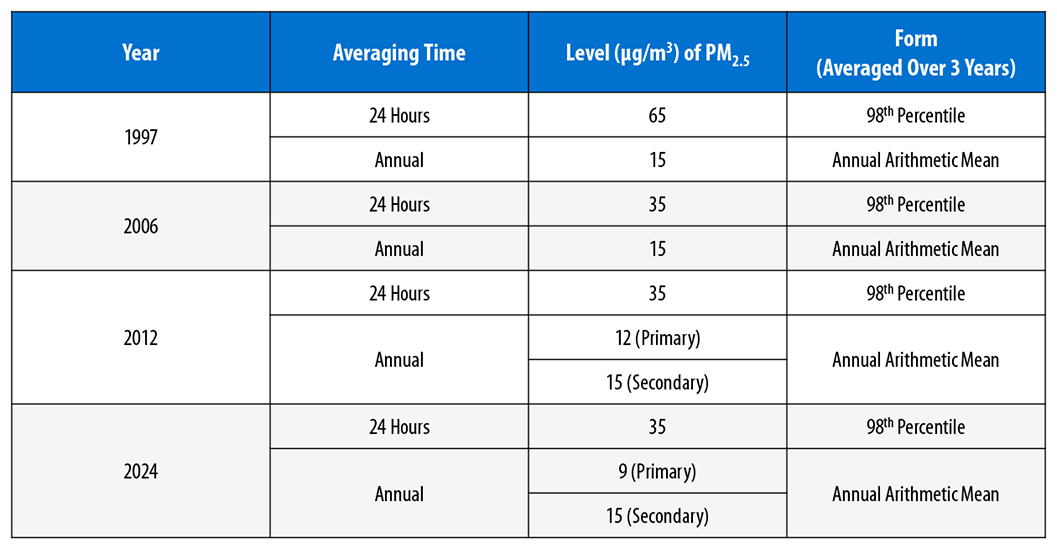
Although the relative toxicity of different PM2.5 components has been a priority research area for multiple decades now, US EPA’s National Ambient Air Quality Standards (NAAQS) continue to consist of total PM2.5 mass-based standards that do not take chemical composition into account. The current NAAQS for PM2.5 includes a primary annual standard of 9 μg/m3, reduced from 12 μg/m3 based on the evidence and conclusions reached in the US EPA’s “2019 Integrated Science Assessment for Particulate Matter” (US EPA, 2021, 2024) and available exposure and risk information. In addition, the agency has promulgated a primary 24-hour PM2.5 standard of 35 μg/m3, as well as a secondary 24-hour PM2.5 standard of 35 μg/m3. Primary standards are health based, while secondary standards are based on public welfare considerations (e.g., visibility and climate) (US EPA, 2024).
The chemical composition of PM2.5 has changed over time in the US, as illustrated in the figure below (see Figure). Further, there is increasing evidence indicating differences in PM2.5 toxicity, depending on PM2.5 composition and source, which has important public health implications. At the global level, the residential energy sector was the largest contributing source to the estimated 2017 PM2.5 disease burden, along with smaller sectors, such as waste, fires, solvent use, and international shipping (McDuffie et al., 2021).
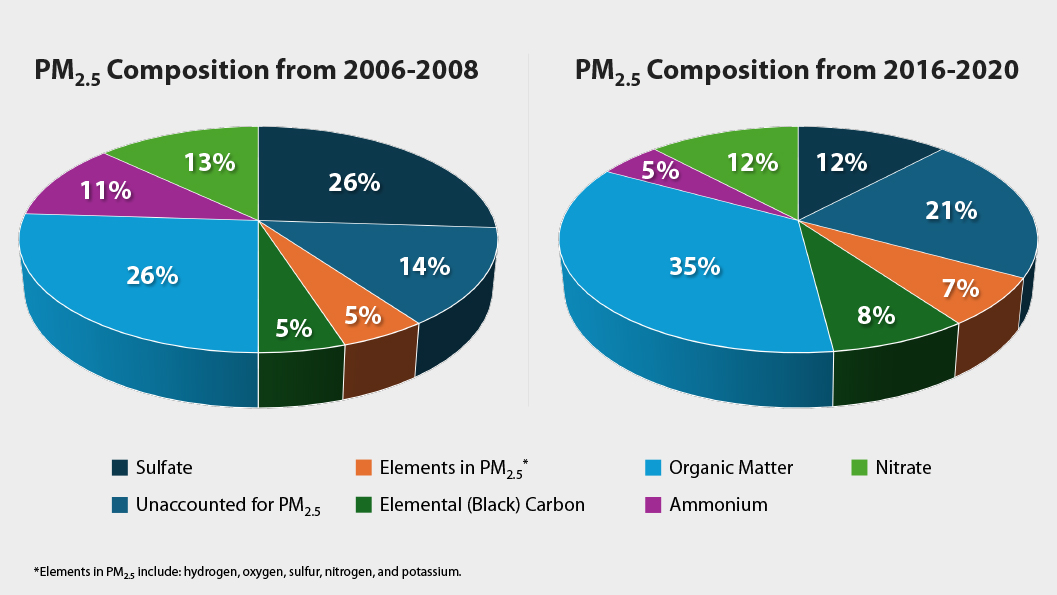
As the figure shows, over the past two decades, there has been a significant change in nationwide PM2.5 composition. For example, the percentage of organic matter increased during 2016-2020 compared to 2006-2008, while the percentage of sulfates, largely generated from coal combustion, decreased. The difference between PM2.5 concentrations and the sum of chemical composition can be attributed to uncertainties in PM2.5 mass and chemical composition measurements.
From 2005 to 2016, multiple air pollution regulations were enacted in the US at the state and federal level. Such policy changes include improvements in liquid fuel quality, controls on emissions from heavy-duty diesel vehicles, and reductions in emissions from electricity generating units (EGUs), especially coal-fired power plants (US EPA, 2021; Cheng et al., 2024). In addition, economic changes (e.g., lower natural gas prices) within the electricity generation sector have significantly changed its emissions. This combination of policy implementations and economics has resulted in substantial reductions in PM2.5, its major constituents, and source-specific PM2.5 concentrations of multiple PM2.5 components, including SO42-, NO3–, and primary organic carbon (US EPA, 2021).
At the same time, a growing body of research provides evidence of the differential health risks posed by source- and chemical component-specific PM2.5. For example, a recent study aimed to quantify the unequal health risks and mortality burden of source-specific PM2.5 in China. China has grappled with severe PM2.5 pollution as the world’s largest producer and consumer of fossil fuels and its reliance on coal-dominated energy (Du et al., 2024). In this study, transportation-related PM2.5, from both petrol (i.e., gasoline) and diesel vehicles, showed the strongest association with cause-specific mortality per PM2.5 increment. When compared with power generation, the study estimated transportation sources to have 1.51-fold and 3.43-fold higher excess deaths in 2013 and 2018, respectively, and the largest estimated excess deaths were reported for residential PM2.5 (e.g., heating and cooking) (Du et al., 2024). For 2018, the transportation sources accounted for 15.16% of PM2.5 but contributed to 28.8% of excess mortality (Du et al., 2024). Overall, this study serves as an illustrative example addressing the public health implications of the differential risks posed by PM2.5 from various sources.
The NAAQS for PM2.5 have evolved significantly since the US EPA promulgated its first PM2.5 standard in 1997 (see Table). The next frontier may be source- and/or chemical component-specific PM2.5 standards, depending on continued characterization of existing composition and trends, as well as the expanding knowledge base regarding the effects of different PM2.5 compositions on human health. There is large uncertainty as to whether the US EPA will establish source- or chemical component-specific PM2.5 NAAQS, but future implementation of such standards would clearly have major regulatory implications across industrial sectors.
The author can be reached at Nicholas.Drury@gradientcorp.com.
Cheng, B; Alapaty, K; Arunachalam, S. 2024. “Spatiotemporal trends in PM2.5 chemical composition in the conterminous U.S. during 2006–2020.” Atmos. Environ. 316:120188. doi: 10.1016/j.atmosenv.2023.120188.
Du, P; Du, H; Zhang, W; Lu, K; Zhang, C; Ban, J; Wang, Y; Liu, T; Hu, J; Li, T. 2024. “Unequal health risks and attributable mortality burden of source-specific PM2.5 in China.” Environ. Sci. Technol. 58(25):10897-10909. doi: 10.1021/acs.est.3c08789.
McDuffie, EE; Martin, RV; Spadaro, JV; Burnett, R; Smith, SJ; O’Rourke, P; Hammer, MS; van Donkelaar, A; Bindle, L; Shah, V; Jaegle, L; Luo, G; Yu, F; Adeniran, JA; Lin, J; Brauer, M. 2021. “Source sector and fuel contributions to ambient PM2.5 and attributable mortality across multiple spatial scales.” Nat. Commun. 12(1):3594. doi: 10.1038/s41467-021-23853-y.
Thangavel, P; Park, D; Lee, YC. 2022. “Recent insights into particulate matter (PM2.5)-mediated toxicity in humans: An overview.” Int. J. Environ. Res. Public Health 19(12):7511. doi: 10.3390/ijerph19127511.
US EPA. 2021. “Integrated Science Assessment for Particulate Matter (Final).” EPA/600/R-19/188. September. 1967p.
US EPA. 2024. “Reconsideration of the National Ambient Air Quality Standards for particulate matter (Final rule).” Fed. Reg. 89(45):16202-16406. 40 CFR 50, 53, 58. March 6.