

Winter 2023
Advanced tools are being implemented to downscale current global climate model predictions to more accurately assess potential impacts at the local level.
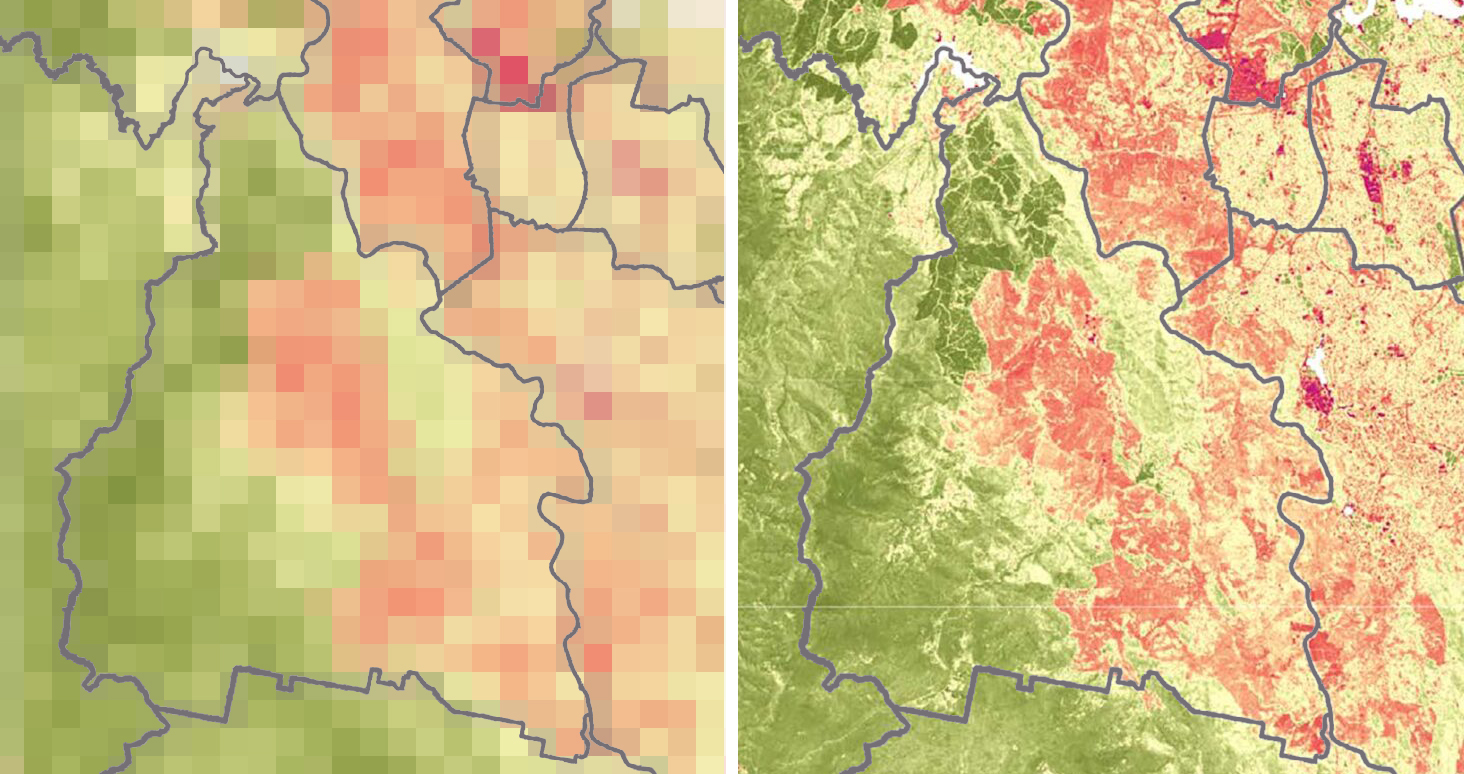
Global climate models (GCMs) provide an unprecedented view of the planet’s future climate at 10, 50, or 100 years into the future. From these models, researchers can discern impacts on natural resources, infrastructure, human health, and commerce, and report significant findings, such as rising global temperatures, mean sea-level rise, and stronger hurricanes. These impacts, however, are not distributed evenly around the globe. Empirical observations have shown that sea levels are rising on average, though some areas of the planet are experiencing higher rates of sea-level rise and others have essentially stable sea levels (US EPA, 2022). GCMs divide the surface of the earth into large grid cells, approximately 100 to 200 kilometers across, and provide a high-level, “bird’s-eye” view of global climate. These predictions, however, are typically too coarse to predict what will happen in an individual watershed or at a specific city or industrial facility. Local planning and decision-making requires information about future climate at local scales (roughly one kilometer) that are not often apparent in GCM outputs. Now, researchers are using advanced statistical techniques and models to “downscale” GCM predictions to understand impacts at the local level.
Local planning and decision-making requires information about future climate at local scales (roughly one kilometer) that are not often apparent in GCM outputs.”
Downscaling tools use GCM outputs at global scales to derive climate predictions at local scales that are relevant to decision-makers. These predictions might include precipitation over the course of a typical year in a specified city, the rate of sea-level rise at a coastal manufacturing facility, and temperature fluctuations and extremes at key agricultural fields or orchards. Researchers can also couple the results of downscaling with hydrological modeling tools, providing a powerful method to evaluate local impacts on water resources.
For example, Climate Impacts Group et al. (2014) assessed projected changes to hydrologic extremes in the Pacific Northwest by using downscaled climate variables, including temperature, precipitation, snow water equivalent, and runoff. The researchers estimated climate extremes, such as a 100-year flood (Q100) and “low August soil moisture,” based on the higher-resolution detail of the downscaled projections, which was not readily available in GCM outputs (Climate Impacts Group et al., 2014). For example, using downscaling techniques, model output shows mountainous regions with consistent drying. Further, snowpack vulnerability results indicated a shift in the 2040s from snow to more transitional weather (mixed rain and snow), particularly in the northern Rockies and southern Cascades. Further, Q100 extremes would likely be exceeded more frequently in the Cascades and much of the Southwest, while hydrological findings in other areas of the West revealed more uncertainty.
Similarly, Seattle Public Utilities (SPU) conducted a water resource vulnerability assessment using downscaled climate data, examining the potential impacts of climate change on the availability of water, runoff, and flood risks (US EPA, 2011). This vulnerability analysis identified several future challenges to SPU water supplies, including a decrease in available water, an increase in runoff and flood risks, and changes in water demand that varied by decade relative to historical levels (US EPA, 2011).
Besides using downscaled climate data to assess water supply vulnerability on local scales, many studies have also focused on the impacts of climate change on agricultural production, which is highly dependent on climate variables, such as precipitation, temperature, and solar radiation. For instance, Lee and Six (2010) used multiple downscaling methods to predict changes in crop yield due to climate change specifically in California’s Central Valley, an important agricultural region in the United States. Simulations suggested that, by the end of the century, crop yields would decrease, particularly for cotton and sunflowers. Further, Hong et al. (2020) used similar techniques and downscaled climate data to investigate the impacts of ozone and a changing climate on yields of perennial crops in specific regions of California. Perennial crops, such as fruits and nuts, represent over a third (roughly 38 percent) of California’s agriculture by economic value. Under the influence of warming and ambient ozone, this study found that the projected yields of most perennials showed a significant decrease, ranging from 2 percent for strawberries to 22 percent for table grapes. Importantly, the impacts to these crops varied regionally across California – a finding which would not have been possible at the coarse spatial scale of GCM projections.
While climate change is causing an increase in global temperature, mean sea-level rise, and the frequency and intensity of extreme weather, advanced downscaling techniques are now available to provide higher-resolution scales of GCM projections, which are better suited to local-level analysis and planning than global projections. Combining downscaled results with hydrological and crop modeling tools to assess the future vulnerability of water resources and agricultural production are just two examples of the many powerful applications of these new tools.
The authors can be reached at ttang@gradientcorp.com and jrominger@gradientcorp.com.
Climate Impacts Group; Littell, JS; Mauger, GS; Salathé, EP; Hamlet, AF; Lee, SY; Stumbaugh, MR; Elsner, M; Norheim, R; Lutz, ER; Mantua, NJ. 2014. “Uncertainty and Extreme Events in Future Climate and Hydrologic Projections for the Pacific Northwest: Providing a Basis for Vulnerability and Core/Corridor Assessments.” Report to Department of the Interior Pacific Northwest Climate Science Center. 19p. February 28. Accessed on November 17, 2022, at https://cig.uw.edu/wp-content/uploads/sites/2/2021/02/Litteletal2014_CSCFinalReport717.pdf.
Hong, C; Mueller, ND; Burney, JA; Zhang, Y; AghaKouchak, A; Moore, FC; Qin, Y; Tong, D; Davis, SJ. 2020. “Impacts of ozone and climate change on yields of perennial crops in California.” Nat. Food 1:166-172. doi: 10.1038/s43016-020-0043-8.
Lee, J; Six, J. 2010. “Effect of climate change on field crop production and greenhouse gas emissions in California’s Central Valley.” In Proceedings of the 19th World Congress of Soil Science, Soil Solutions for a Changing World, Brisbane, Australia, August 1-6. 4p.
US EPA. Office of Research and Development, National Center for Environmental Assessment (NCEA). 2011. “Climate Change Vulnerability Assessments: Four Case Studies of Water Utility Practices.” EPA/600/R-10/077F. 72p. March. Accessed on November 17, 2022, at https://ofmpub.epa.gov/eims/eimscomm.getfile?p_download_id=501095.
US EPA. 2022. “Climate Change Indicators: Sea Level.” August 1. Accessed on November 18, 2022, at https://www.epa.gov/climate-indicators/climate-change-indicators-sea-level.